


 Products & Services
Data Analysis & Business Intelligence
Know what moved, what earned money, and what needs attention.
How it works
One dataset
Spreadsheets, databases and system exports come together.
Agree what each number means
Then check whether the data can support the answer.
Reports that answer the question
See what moved, what earned money and what needs attention.
Illustration only. Names and figures are made up.
Read the full description
We bring spreadsheets, databases and business-system exports into one consistent dataset. We agree on the meaning of each number with your team, then build repeatable reports and dashboards. The tools can include SQL, Python and your existing reporting platform; the choice follows the job.
Past work includes cleaning 20 years of sales and inventory records for a Canadian building-material distributor, and cleaning delivery CSV files with business rules, automated calculations and trend analysis. Our warehouse work connects stock movement and loading records. These projects were delivered through our Canadian company.
Example questions: Which items are sitting too long? Do receipts and dispatches match the stock balance? Which product or channel has the strongest margin after agreed costs? How do this month’s sales compare with last year? We first check whether your data can support the answer.
For plain-language questions, AI translates the request into a controlled, read-only query. The database calculates the figures. The answer shows its source and assumptions. Start with a sample export and one decision you need to make; we scope a pilot before expanding.
What is included
Inventory & warehouse operations
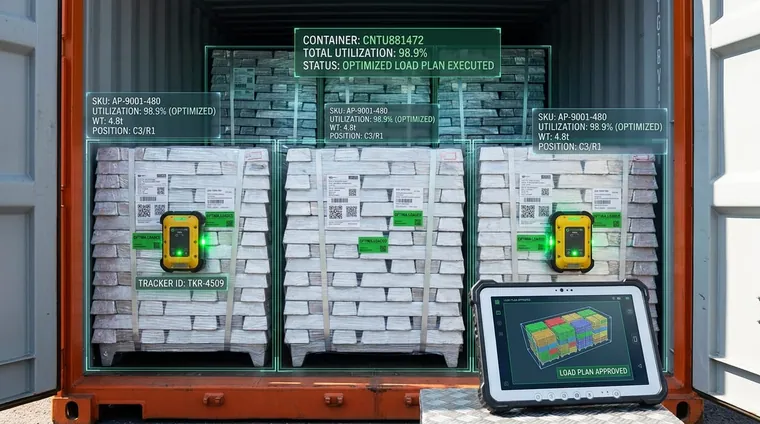
Match receipts, dispatches, returns and balances by item. Flag missing records, slow-moving stock and unusual movements.
Finance & margin analysis
Reconcile channels and calculate margins using approved cost, fee and allocation rules. Keep exceptions visible for finance review.
Sales & procurement
Compare product, customer and seasonal trends. Assess replenishment decisions against demand history and supplier lead times.
Dashboards & scheduled reporting
Deliver an agreed dashboard or report, with scheduled refreshes and checks for incomplete data.
Key strengths
Traceable calculations
Every total follows an agreed rule and can be checked against source records.
Fit your existing tools
Use the reporting tools your team can maintain, with documented definitions and handover.
What we need from you
Sample source exports, rate or cost rules, and a manually checked reporting period.
Deliverables
- A mapping of source fields, products and units
- Repeatable calculation and reconciliation reports
- Exception lists plus traceability to the source record
How it is accepted
Reconcile a held-out period against the agreed manual baseline, investigate differences and rerun the same inputs to check consistency.
Case studies
Start with one small pilot.
Tell us the task. We will say whether it is worth doing.